
picture alliance / ASSOCIATED PRESS | Uncredited
Tracker
Economic Indicators
China’s economy leaves a mixed picture in Q1
MERICS Economic Indicators Q1/2024
MERICS Q1 analysis: Government keeps to a steady course amid signs of economic improvement in Q1
China’s leadership set its annual GDP growth target at 5 percent for 2024 during the Two Sessions gathering of China’s legislature, held in March. Growth got off to a good start as GDP expanded by 5.3 percent in Q1, compared to 5.2 percent in Q4 2023. But the economy is not yet out of trouble as key indicators show a mixed picture. After a good first two months, it lost momentum in March. Growth in Q1 continued to be driven by industrial production and manufacturing investment, rather than consumption, a pattern that is in line with the government’s economic policy priorities.
Government support for the economy is focused on stabilization rather than full-blown stimulus. Its policy objective is to develop new growth drivers for China’s economy as part of Xi Jinping’s transition towards his vision of higher-quality growth. The latest buzz words are around establishing “new productive forces” as part of Xi’s emphasis on innovation, high-tech and emerging technology.
Economic growth faces some challenges but - from the government’s perspective - it is still good enough. It was predictable that the transition to a new tech driven growth model would not be smooth. Despite the ongoing challenges in consumption or employment, the leadership seems relatively unconcerned. It is signaling its willingness to maintain a steady policy course and its commitment to the ongoing transition. The message: some economic pain in parts of society must be endured. There is no reason expect major stimulus or a return to the old growth model they are trying to leave behind.
Internationally, more tensions are looming despite efforts to woo foreign companies as happened at the China Development Forum attended by roughly 90 CEOs of major multinationals in late March. China’s major trading partners are growing concerned that the country’s alleged industrial overcapacities will lead to Chinese goods flooding global markets. China has a dominant position in green tech, from solar panels, wind power equipment, to batteries. Rising e-vehicle exports are certainly causing tensions. The EU has announced several investigations into dumping allegations and Brazil has launched a similar inquiry. China’s exports will need to weather the challenges and are likely to slow (though not drastically), providing the economy with less lift in 2024.
China’s real estate woes are one of the biggest challenges facing its economy. In the wake of the government’s crackdown on real estate developers’ bad debts, investment in the sector is stalled, which impacts economic growth, while falling housing prices are affecting consumer sentiment. Fallout from the real estate sector’s problems continued over Q1 2024 and has yet to stabilize. Consumer sentiment continues to be fragile, hurt by a weak labor market and lower wage growth.
The government’s economic policy has not changed much in the face of these domestic and international pressures. It is purposely limiting stimulus measures and prioritizing developing its new tech driven growth model. The leadership seems to hope that weak sentiment will subside eventually, once the economic transition makes progress. However, there is also a risk that growth momentum will stall further over the second quarter, which would increase the pressure to make more forceful adjustments. For now though, the government is holding a steady course.
The MERICS China Confidence Index (MCCI)
The MERICS China Confidence Index measures household and business confidence in future income and revenues. The index is weighted between household and business indicators. It includes the following indicators: stock market turnover, future income confidence, international air travel, new manufacturing orders, new business in the service sector, urban households’ house purchase plans, venture capital investments, private fixed asset investments and disposable income as a share of household consumption. All components have been tested for trends and seasonality.
The MCCI was first developed in Q1 2017.
![]() Hover over/tap the charts to see more details.
Hover over/tap the charts to see more details.
Exhibit 1
Macroeconomics: China’s GDP growth is off to a good start in Q1 2024
Exhibit 2
![]() Hover over/tap the charts to see more details.
Hover over/tap the charts to see more details.
Exhibit 3
- China’s economy expanded more strongly than expected in Q1. Market forecasts had expected GDP to increase by 5 percent, but it grew by 5.3 percent year on year. Although higher GDP growth masks some challenges, such as weak consumption and deflation, the economy got off to a good start. While it is still early days, China’s Q1 performance makes the official 2024 growth target of around 5 percent look more attainable. (see exhibit 2).
- Stronger than expected Q1 growth will curb expectations of more, expanded stimulus measures. The government’s policies will try to address shortcomings, most notably weak employment and foreign direct investment, but major support measures look unlikely for now.
- Growth momentum further improved in Q1 putting growth on a more solid footing. Measured on a quarter on quarter basis, GDP expanded by 1.6 percent in Q1, up from 1.2 percent in Q4 last year.
- Much of the dynamic in Q1 was attributed to the manufacturing sector, which has now become a key driver of growth. The manufacturing sector expanded by 6.4 percent in Q1, up from 5.3 percent in Q4 last year, hitting its fastest pace since Q2 2021.
- Stronger growth in the manufacturing sector was enough to off-set the slowdown in real estate (see exhibit 3). The struggling real estate sector deepened its contraction, shrinking at the second fastest pace since the early pandemic shutdowns and fears in Q1 2020.
What to watch: If GDP growth can remain strong in Q2, confidence in China’s economy will increase.
Business: Manufacturing performs strongly in Q1, helped by base effects
Exhibit 4
![]() Hover over/tap the charts to see more details.
Hover over/tap the charts to see more details.
Exhibit 5
- Value-added output in the manufacturing sector grew 6.7 percent year on year in Q1. After January and February growth of 7.7 percent, it eased back to 5.1 percent in March. However, growth figures for the first two months were boosted by base effects, as industrial activity was dampened by the unwinding of the zero-Covid policy in early 2023 (see exhibit 4).
- Production of green and digital technologies surged in March; output of new-energy vehicles (NEVs) rose by 33.5 percent, of solar cells by 28.7 percent and integrated circuits by 28.4 percent. Q1 output of electric vehicle charging facilities, 3D printing devices and electronic components went up by 41.7 percent, 40.6 percent and 39.5 percent respectively.
- The lack of investment in real estate is lowering the output of construction-related raw materials. In March, the value-added output of cement fell by 22 percent and crude steel by 7.8 percent.
- Industrial inventory remained steady, increasing only 0.8 percent in January and February. After double-digit increases through most of 2021 and 2022, inventory growth has been 1.2 percent or lower since May 2023, indicating an uptick in demand. Industrial profits expanded by 10.2 percent over the first two months. This marks a significant improvement over 2022 (-4 percent) and 2023 (-2.3 percent).
- The Manufacturing Purchasing Managers’ Index (PMI) jumped to 50.8 percent in March, up 1.7 percentage points on the previous month, suggesting far greater optimism among companies. The new orders index climbed to 53 percent, up from 49 percent in February.
- Industrial capacity utilization rate in manufacturing fell to 73.8 percent, the lowest level on record since 2017, apart from the start of the Covid-19 pandemic in Q1 2020. The largest falls were in the automotive sector (64.9 percent) and the electrical machinery and equipment sector (72.9 percent). Both these sectors have had significant investment in the past two years (see exhibit 5).
What to watch: Supply side support will continue to funnel investment into the manufacturing sector, leading to robust output, with value added production growth likely to be less volatile in the coming months.
International trade and investment: Exports continue to provide a crucial lift for China’s manufacturing sector
Exhibit 6
![]() Hover over/tap the charts to see more details.
Hover over/tap the charts to see more details.
Exhibit 7
- China’s foreign trade expanded by 1.5 percent in Q1 valued in USD compared to the same period last year. Measured in yuan, China’s foreign trade reached CNY 10.17 trillion, the first time it has exceeded the 10 trillion mark in the first quarter. Exports remain a key pillar of economic growth. This is problematic as growing concerns over alleged overcapacity in China and dumping of Chinese goods on global markets means exports are likely to face pushback this year.
- Exports remain strong despite a sharp growth slowdown in March. They grew strongly in January (8.2 percent) and February, but then contracted by 7.5 percent in March in USD terms. The slowdown was mainly due to comparison with the high growth rate in March 2023. Although exports started to level off in Q1, they remain around 40 percent above 2019 levels (see exhibit 6).
- In key commodities, quantity outpaced value, a further sign of robustness. This suggests that companies may be compensating for weak domestic demand by boosting international sales. For example, the value of exported smartphones fell by 13 percent in Q1, but the number of units exported rose 6.3 percent. Similarly, steel exports fell by 12.9 percent measured in US dollars, yet the volume of steel exports went up by 30.7 percent.
- Imports grew by 1.5 percent in Q1 on the back of strong growth in January (15.4 percent), though they contracted in February and March. Early signs of stronger activity in construction may be visible in some building-related imports such as iron ore, which was up 16.8 percent by volume in Q1.
- The hoped for increase in demand for key manufacturing goods by China’s trading partners largely failed to materialize. Imports of automobiles (-17.1 percent), machine tools (-5.9 percent) and medical equipment (-9.7 percent) all contracted in Q1 compared to the same period last year. Imports from major EU countries were down, except for the Netherlands, where growth was probably due to ongoing high imports of semiconductor-related equipment (see exhibit 7).
What to watch: If trade imbalances with major trading partners persist, the risk of escalated trade disputes will increase.
Financial markets: Investors unconvinced by cautious monetary easing
- The People's Bank of China (PBoC) is trying to regain trust while limiting monetary policy support for the economy. It has tried to cushion the financial fallout from bankrupt or near-bankrupt real estate developers. But no solution has materialized to deal with real-estate developers’ non-performing assets, or clean-up local banks. Similarly, state investors were called upon to support stock prices as they tumbled earlier this year, in a bid to calm financial markets.
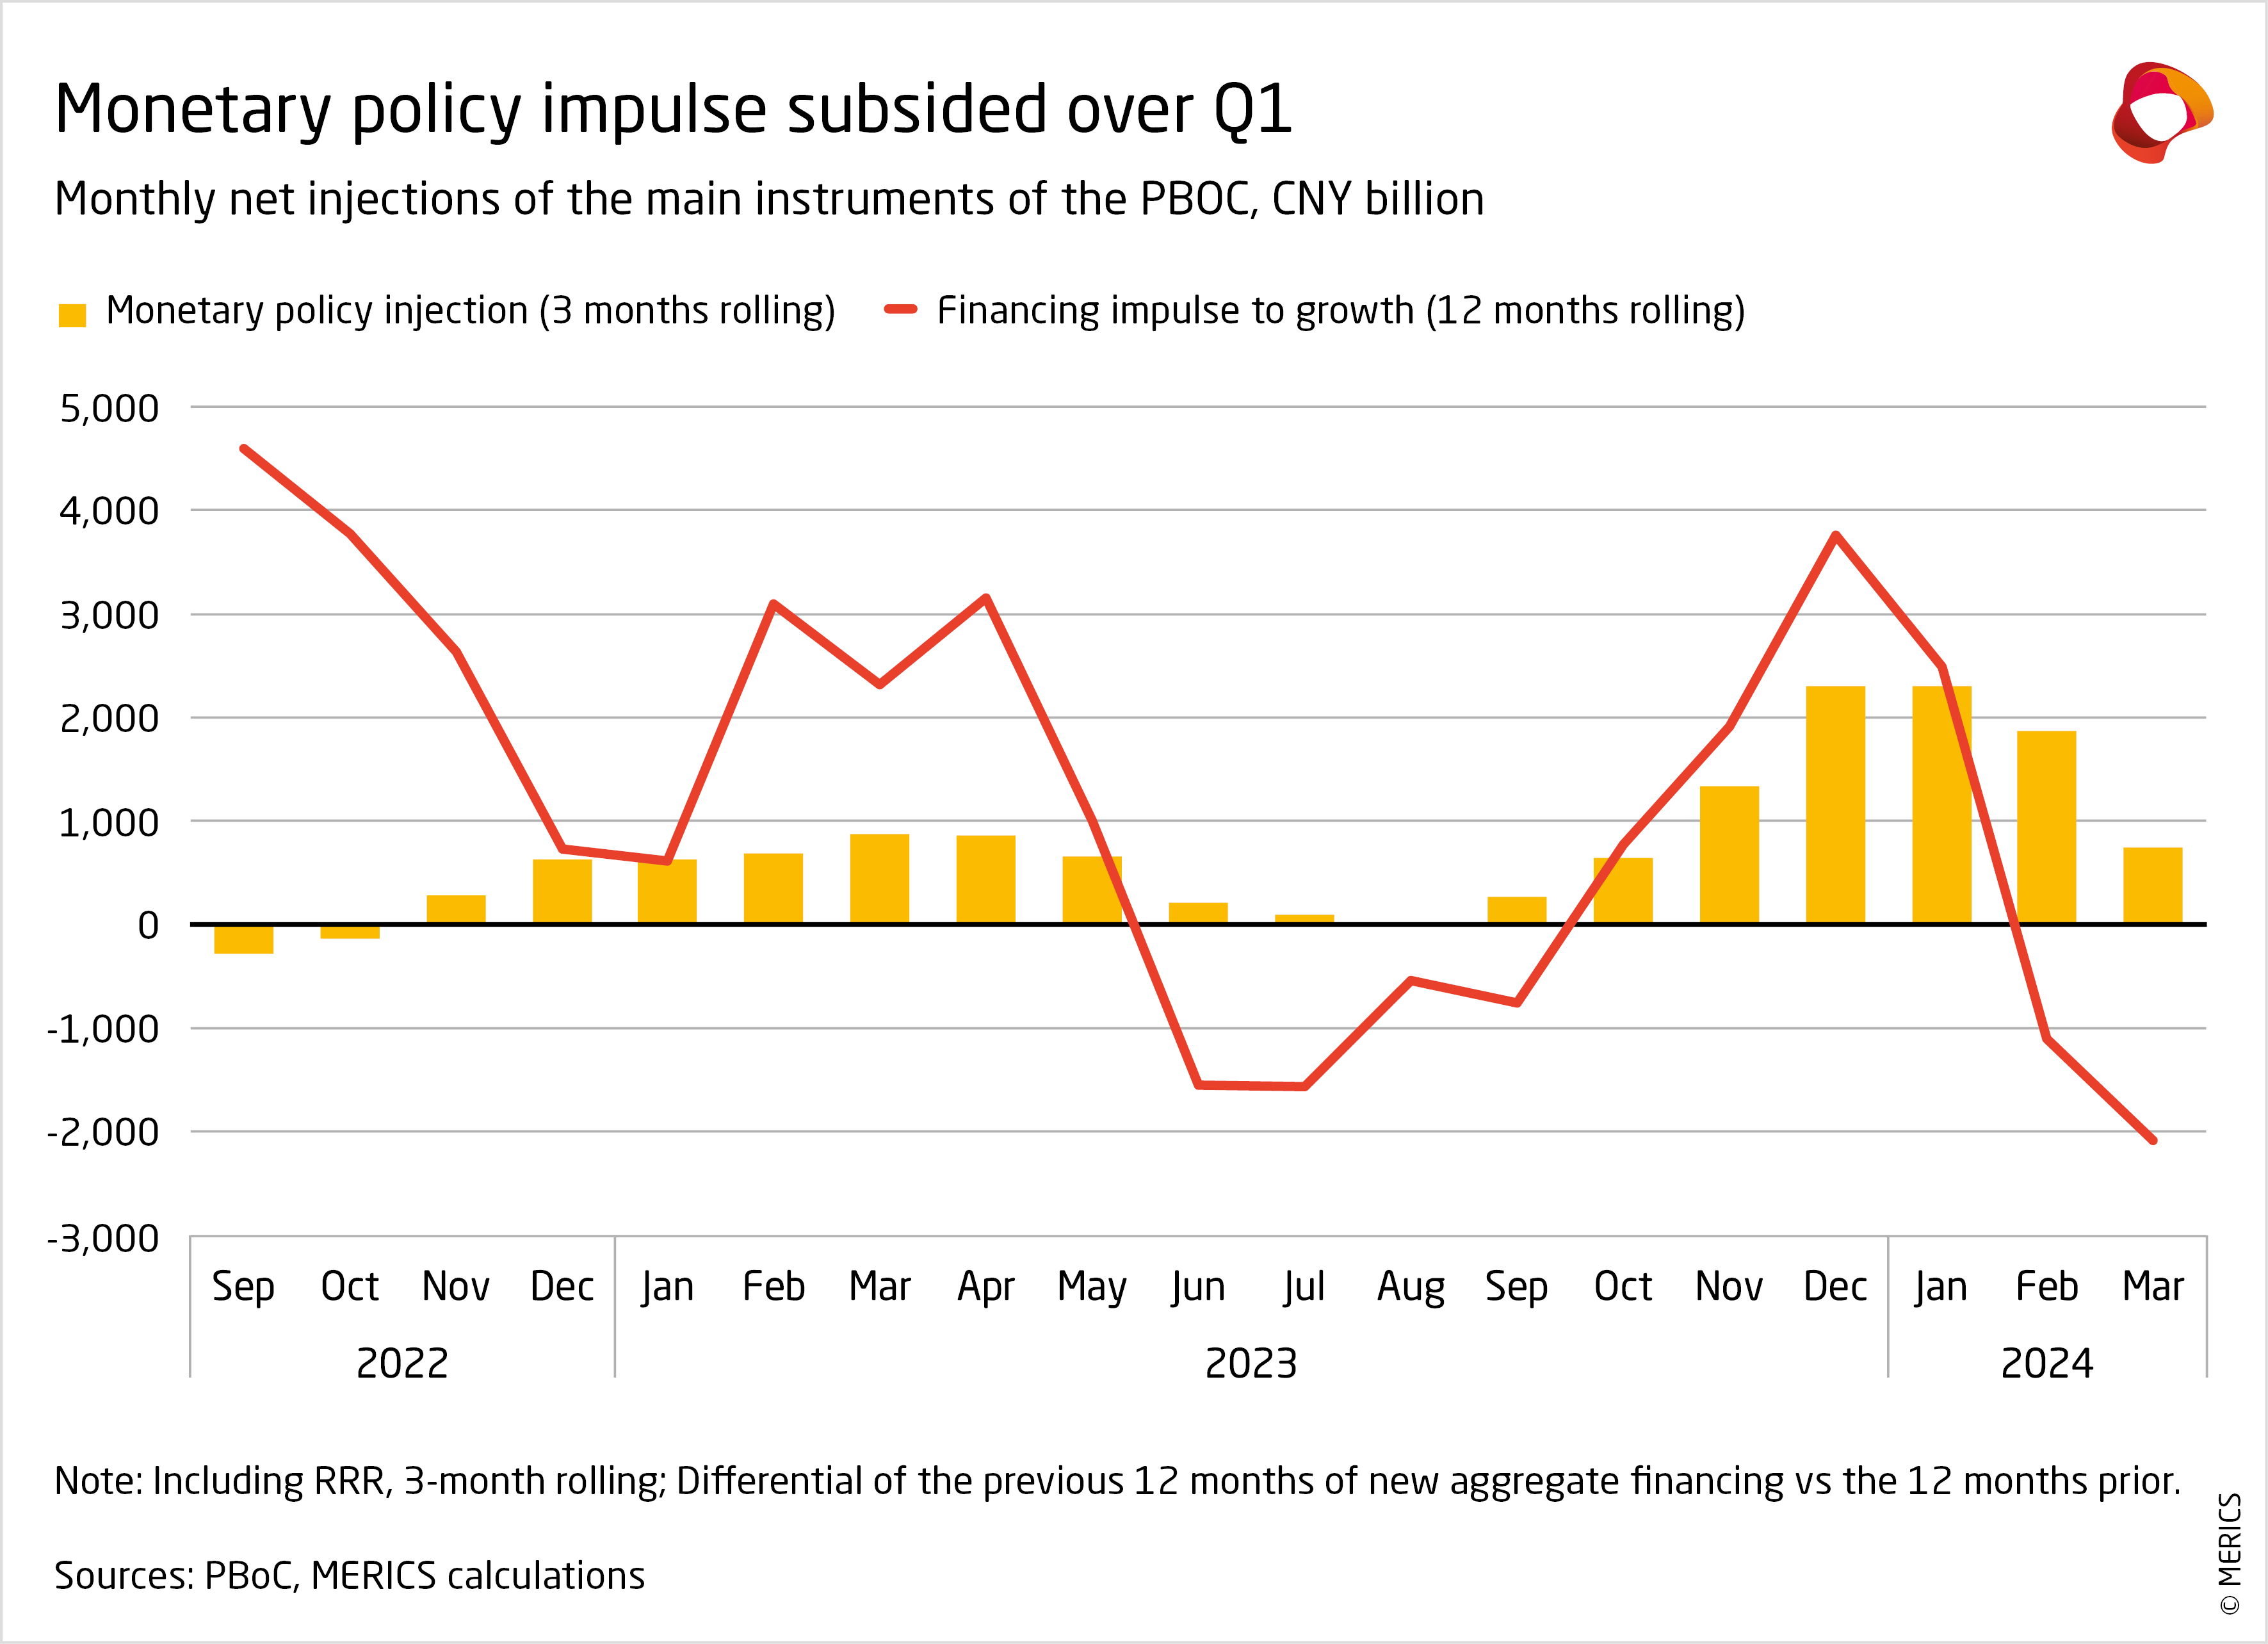
- The PBoC increased support for the economy over Q1, but remains wary of stimulus measures. Banks’ reserve ratio requirements (RRR) were lowered by 50 percentage points, unleashing CNY 1 trillion of long-term liquidity. Next came an unprecedented 25 base points cut in the leading policy rate, though only for medium to long term bank loans.
- Credit demand remained sluggish. Total social financing to the real economy fell from 9.8 percent growth at the end of 2023 to 8.7 at the end March year on year (see exhibit 8). Bond and equity financing dwindled further in volatile markets. Net financing was less than CNY 300 billion over Q1, the lowest levels since the Covid pandemic began. However, government bond issuance remained dynamic, rising by 14.7 percent year on year after following strong growth in 2023.
- Bank loans, the other most dynamic financing channel of 2023, also slowed, from 10.9 to 9.2 percent year on year in the three months. Loans to households and long-term loans to firms plummeted at the time of year when banks are usually most disposed towards long term financing, indicating weak demand.
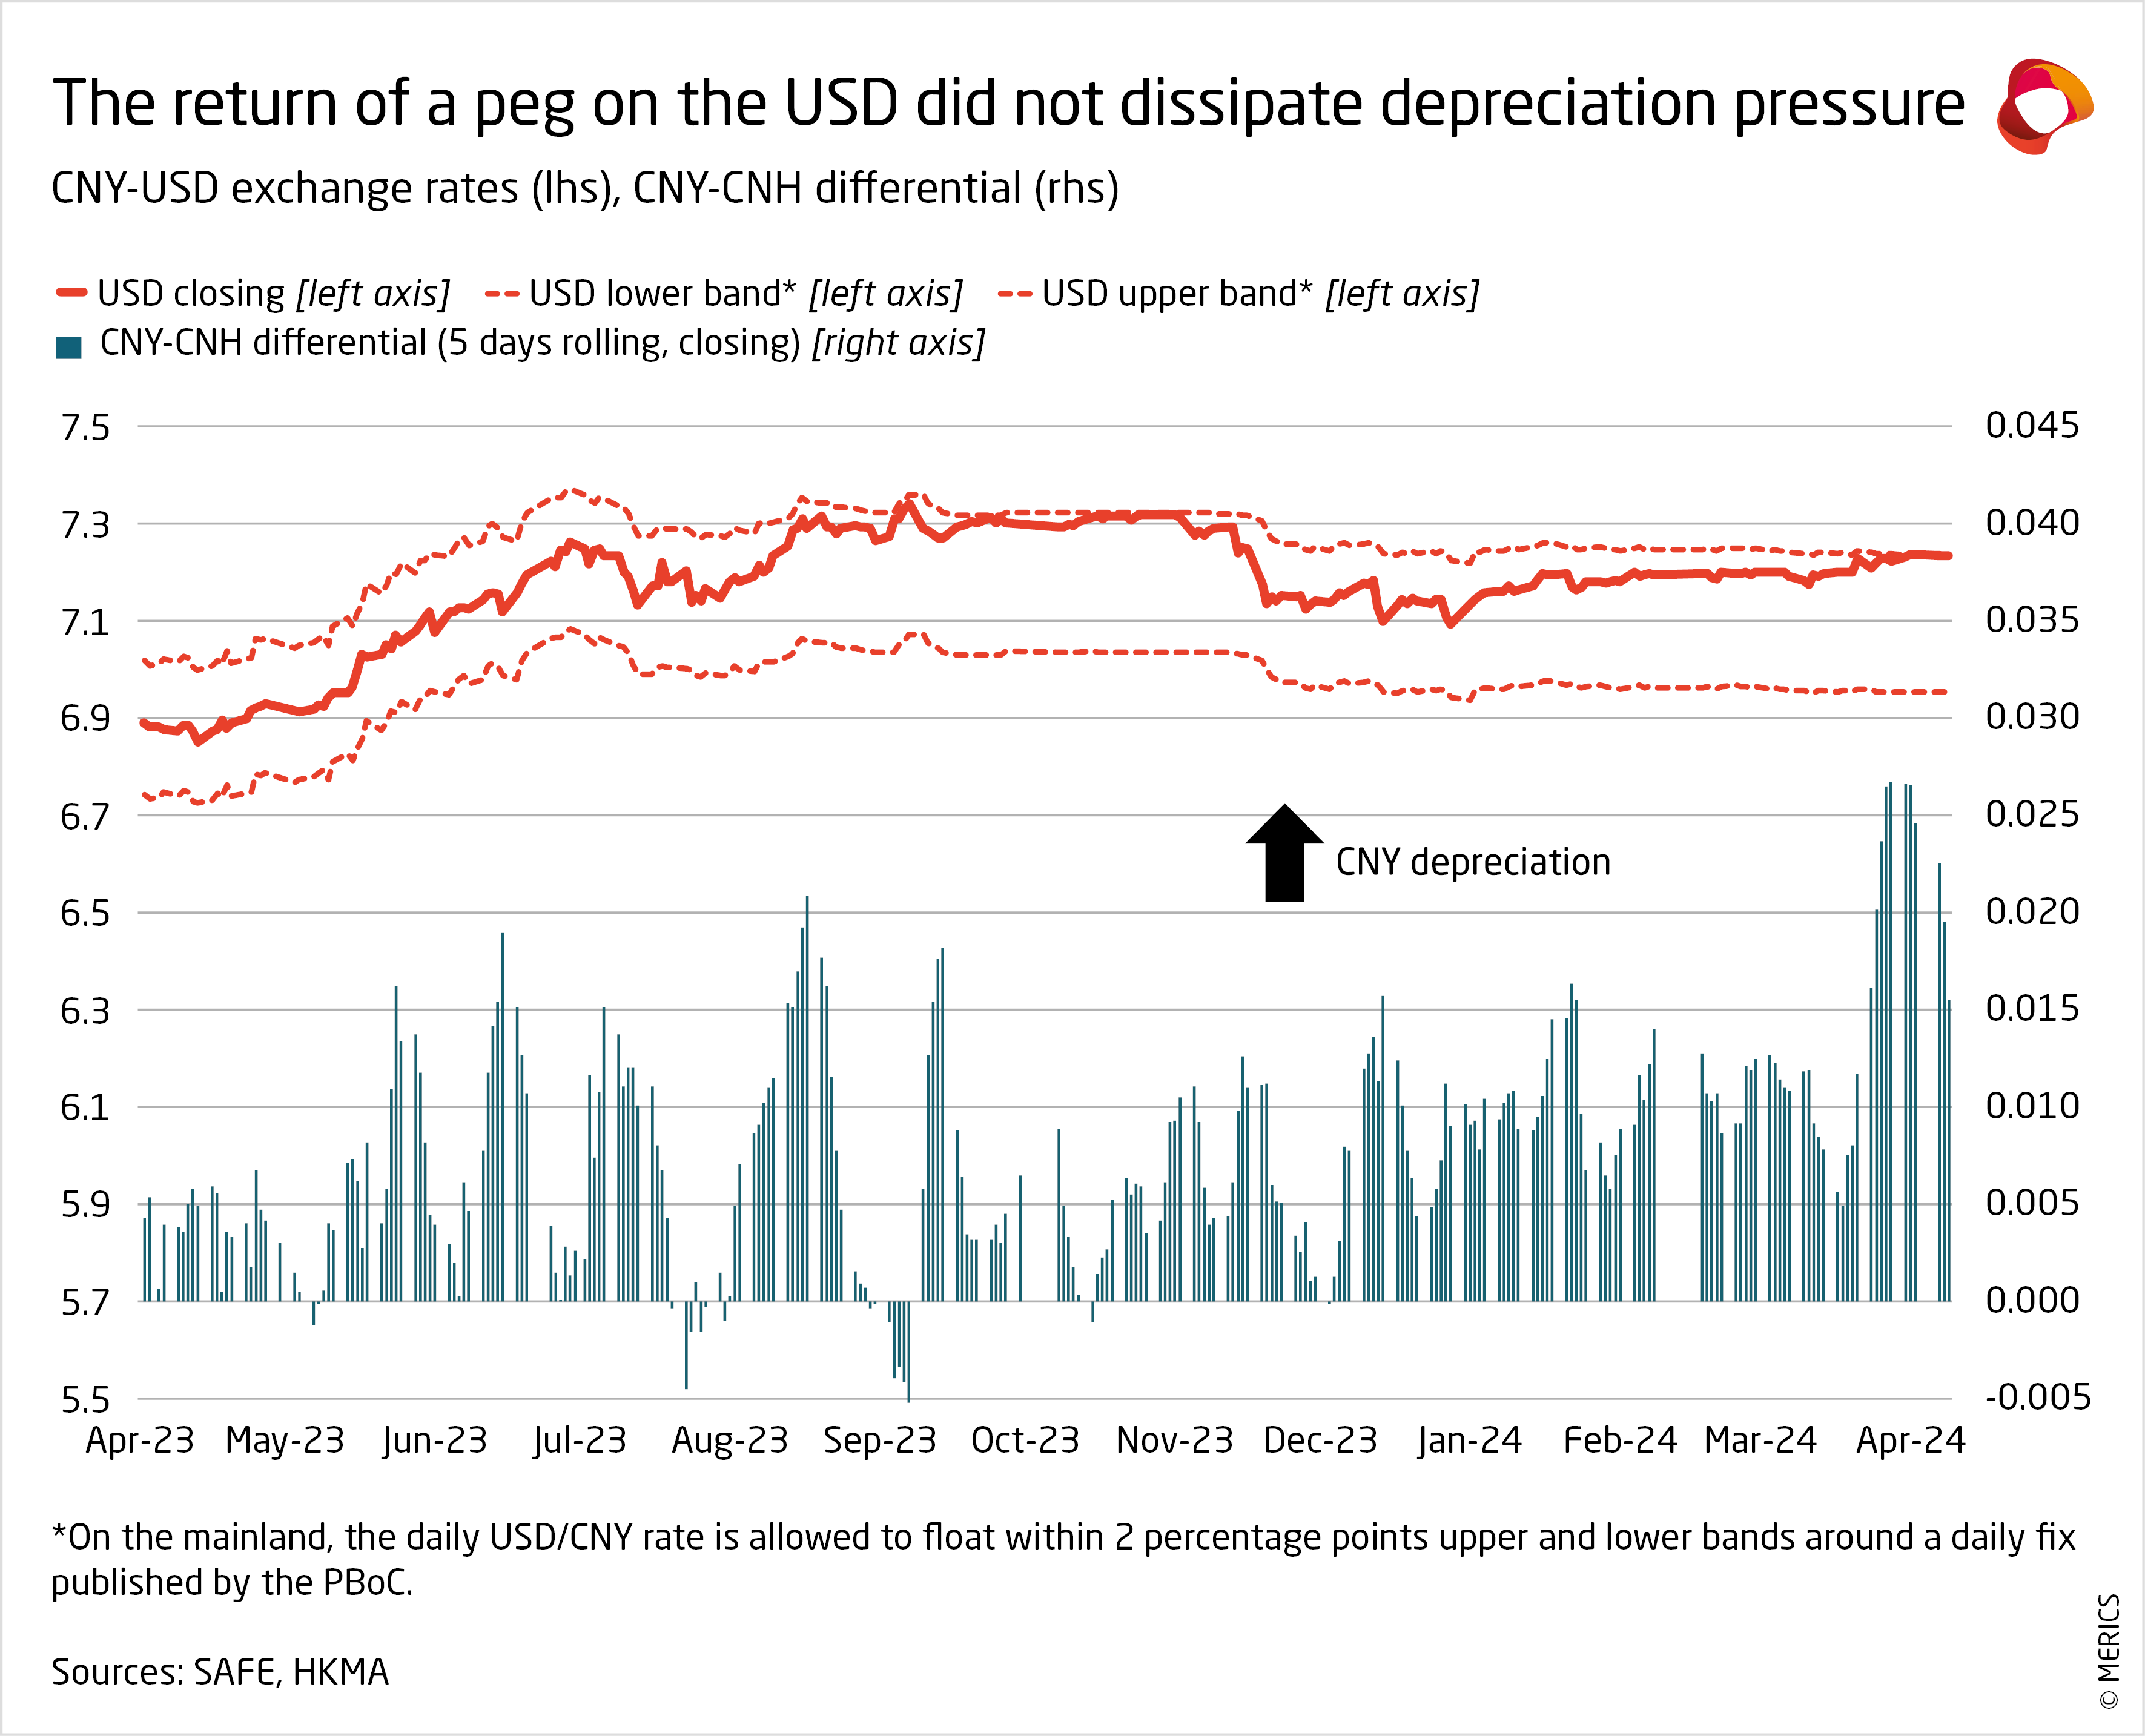
- The foreign exchange market shared the gloomy mood. Depreciation pressure returned after a short pause thanks to the US dollar’s decrease in value (see exhibit 9). China’s currency hit its daily depreciation cap almost every day in late March. The growing discrepancies between the mainland’s CNY exchange rate and the freer CNH one on the Hong Kong markets, where it was trading significantly lower, shows investors remain doubtful.
What to watch: More support will be needed to reach the government’s 5 percent GDP growth target for 2024. The question is how much short-term massaging there will be versus more slow-burning sustainable solutions to generate more efficient Chinese financial markets.
Investment: Manufacturing investment gains pace, removing need for stimulus
Exhibit 10
![]() Hover over/tap the charts to see more details.
Hover over/tap the charts to see more details.
Exhibit 11
- Growth in fixed asset investments (FAI) sustained its turnaround in Q1, building on positive December figures revealing the end of a 10-month slowdown. FAI growth rose to 4.5 percent at the end of March, up from 3 percent at the end of December 2023. Stronger stimulus efforts are therefore less likely or necessary. Investment patterns reflected the government’s policy priorities; FAI was driven by manufacturing as the real estate sector’s importance is diminishing.
- Growth in manufacturing investment jumped to 9.5 percent in March, up 2.9 percentage points on December 2023. The overall gain was despite a sharp slowdown in the automotive sector, where growth fell from 19.4 percent at the end of Q4 to just 7 percent in Q1 year on year.
- High-end manufacturing, which includes medical equipment, specialized chemicals and aerospace, continues to be a key driver of investment, in line with the government’s emphasis on technology-driven growth. While its growth slowed over Q1, investment activity in high-end industries continued to outpace overall manufacturing investment (see exhibit 10).
- Stronger investment in the crucial computer and communication equipment sector, the heart of China’s electronic industries, also helped lift investments. Growth jumped to 14.3 percent at the end of Q1, up from 9.3 percent at the end of Q4. But more traditional sectors also improved. For example, textiles ended an 11-month contraction in Q1, expanding by 12.4 percent in March.
- Private sector growth also ended an 8-month contraction during Q1. Driven by strong manufacturing investment growth (11.6 percent), it accelerated over the first quarter to reach 0.5 percent in March. This was enough to balance out the slowdown in the service sector (which includes real estate).
- The real estate sector remains deep in the red and has yet to bottom out. Overall investment in real estate contracted by 7.5 percent, marginally better than the 8.1 contraction at the end of Q4 last year. Given that new building starts data remains dire, no improvement seems imminent (see exhibit 11).
What to watch: Manufacturing investment will eventually need to normalize, at which point China will need new growth drivers.
Prices: China still facing risk of deflation as gains fade in March
Exhibit 12
![]() Hover over/tap the charts to see more details.
Hover over/tap the charts to see more details.
Exhibit 13
- China’s economy was unable to shake off deflationary risks over the first quarter. Neither consumer or producer prices have shown significant improvements since Q4 2023, despite the government’s ongoing efforts to shore up demand.
- The consumer price index (CPI) narrowly escaped deflation, staying flat in Q1 compared to the first three months of last year. After four consecutive months in deflation, the CPI nudged upwards, expanding by 0.7 percent in February. However, inflation fell back to just 0.1 percent in March, year on year, including the largest month on month drop in four years (down by 2 points).
- Falling food prices were one reason that prices slowed in March. Driven by sharp falls in the price of fresh fruit (-8.5 percent) and eggs (-8.9 percent), food prices contracted by 2.7 percent. In an indication of weak demand, prices for consumer staples contracted throughout the quarter, falling by 0.7 percent in Q1 year-on-year. Consumer services prices rose by 1.1 percent in Q1, amid stronger demand.
- The producer price index (PPI) continued to contract, as it has for 18 consecutive months now. The contraction gradually deepened during the quarter, with the PPI falling by 2.8 percent in March year on year. Falling commodity prices remain a key factor in the malaise, but the PPIs for raw materials and manufactured goods are not faring much better (see exhibit 12).
- Aftershocks from the real estate crackdown failed to subside over Q1 as housing prices continued to tumble. While the magnitude of the price drop might not be great, it continues to be a source of insecurity and a sign that the real estate sector has not yet bottomed out. Prices for both new and secondary homes fell over Q1, with the later contracting by levels last seen in 2015 (see exhibit 13).
What to watch: More substantial stimulus measures aimed at increased demand and prices would indicate government concern about the deflation risk.
Labor market: Hiring got off to a weak start and shows few signs of improvement
Exhibit 14
![]() Hover over/tap the charts to see more details.
Hover over/tap the charts to see more details.
Exhibit 15
- China’s employment woes remain a top concern for the government as companies show little enthusiasm for hiring. A total of 3.03 million new urban jobs were added, slightly lower than the 3 million jobs added in Q1 last year. The government has set a goal of more than 12 million new urban jobs in 2024. After relatively weak demand for labor in January and February, the situation improved slightly in March, but challenges remain.
- Unemployment inched upward in the first two months; in February, it reached the highest level since August 2023 (see exhibit 14). There were some signs of improvement in March, as unemployment fell back to 5.2 percent. However, data for youth unemployment has continued to increase. The National Bureau of Statistics (NBS) has revised the data series after suspending publication of the data. Publication began again in December, showing youth unemployment rose from 14.6 percent in January to 15.3 in March.
- The real estate, education, and internet sectors are all struggling, so they can no longer able to absorb the same large numbers of graduates. Q1 data from recruitment platforms indicates an increase in open positions. China’s employment situation needs to stabilize, especially for recent graduates. With another record cohort of 11.7 million fresh university graduates due to enter the job market this summer, employment pressure is likely to increase.
- Employment sentiment improved slightly in Q1 but still shows signs of entrenched insecurity. Employment sentiment data published by the NBS improved marginally from 77.6 points in December to 80.1 in February (latest figures). Income sentiment improved from 94.7 to 96 in the same period. But both indices have remained below 100 (indicating a negative view) since April 2022.
- Wage data for new positions after the Spring Festival, the traditional start of the hiring season, indicates a rise of around 3 percent on the same period of 2023. Monthly wages reached an average wage of CNY 10,323 (see exhibit 15). But most university graduates the labor market are likely to find the job market less favorable. A popular phrase looks to persist: “You can’t hire a migrant worker for CNY 3,000 but you can certainly hire a university graduate”.
What to watch: Accelerated wage growth would be the strongest sign of a recovery in the labor market.
Retail: Lunar New Year spending helps retail recovery in Q1
Exhibit 16
![]() Hover over/tap the charts to see more details.
Hover over/tap the charts to see more details.
Exhibit 17
- Consumption has continued its recovery from the pandemic related slump. But economic insecurity is dampening consumer sentiment, limiting people’s willingness to spend. The Ministry of Commerce responded by rolling out new support measures in March, including programs helping households to upgrade old automobiles and household appliances for new ones.
- Helped by the first Lunar New Year holidays without Covid measures consumption got off to a good start in 2024 – it rose by 4.7 percent in Q1 year on year. Consumption was particularly strong in January and February, two months in which retail sales rose by 5.5 percent. Growth subsided again in March, up only 3.1 percent year on year, partly due to the comparison with strong growth in March 2023.
- The Lunar New Year boost was clearest in holiday travel, with revenue recovering from a four-year slump. Tourist numbers and tourism-related spending were comfortably above 2019 levels again (see exhibit 16), whereas in 2023 growth had been around 25 percent below pre-pandemic levels.
- Overall demand for services remains a key driver of consumer spending, outpacing spending on retail commodities by a long way. Demand for retail merchandise rose by 4 percent in Q1 year on year but was overshadowed by 10.8 percent growth in spending on services linked to food and beverages. Spending on restaurant meals surged by 12.5 percent in January and February; data for the two months is typically merged to smooth out the effects of the Lunar New Year holiday.
- Vehicle sales in March bounced back from a steep decline in February (see exhibit 17). Strong demand for new energy vehicles (NEV) was a key growth driver as producers announced further price cuts amid fierce competition. By the end of the quarter, NEVs were 41 percent of total vehicle sales, a rise of almost 10 percentage points on Q1 2023.
What to watch: Merchandise sales will need to pick up for retail consumption get on a stronger footing.
Autor(en)

Chief Economist

Senior Analyst

Senior Economist (Büro Brüssel)
Autor(en)
Chief Economist
Senior Analyst
Senior Economist (Büro Brüssel)